The Whale Map
Beyond the Chart, there is a varied ecosystem of different participants that make up the world of trading.
2 min read
Why Does the Price Ignore Your Indicators?
Understanding Liquidation Heatmaps
It has likely happened to you: your RSI indicates oversold conditions, your EMA confirms a bullish trend, and the support level seems unbreakable. You enter the trade, and suddenly, the market makes a violent move against you, hits your Stop Loss, and then returns to the original direction. This wasn't bad luck; it was a liquidity grab.
For institutions (whales), retail traders' orders aren't just numbers—they are "fuel." The market doesn't move because of trendlines; it moves from one liquidity zone to another.
The Heatmap and Liquidation Pools
The liquidation heatmap is a visual tool that shows where the liquidation prices of thousands of traders are concentrated. These points act as magnets for the price.
High-Density Zones: When you see a bright "spot" on the map near $60,000 in BTC, it means there are billions in positions that will be forced to close if the price touches that level.
The Magnet Effect: Institutions need a counterparty to fill their massive orders. To buy cheap, they need others to sell (or be liquidated). This is why the price often "clears" these zones before making the true trend move.
How to Use StopLiq.com to Anticipate Sweeps
Our calculator gives you the advantage that 90% of traders lack: the ability to think like an institutional algorithm. By calculating your exact liquidation price, you can observe if your exit level coincides with a high-density zone on the heatmap. If your liquidation is right under an obvious support level, you are an easy target.
Professional Strategy: Adjust your leverage so that your liquidation price is always behind the large institutional liquidity walls. If the price reaches that point, the market structure will have changed completely and your original thesis will no longer be valid, but you will have survived the preceding "sweep."
Conclusion: Stop Being the Market's Fuel
Professional trading is about identifying where others are trapped and avoiding being in that same position. Stop blindly trusting lagging indicators and start looking at where the real money is. Use mathematics to your advantage, move your liquidation away from the hunting grounds, and trade with the peace of mind of someone who knows the treasure map.
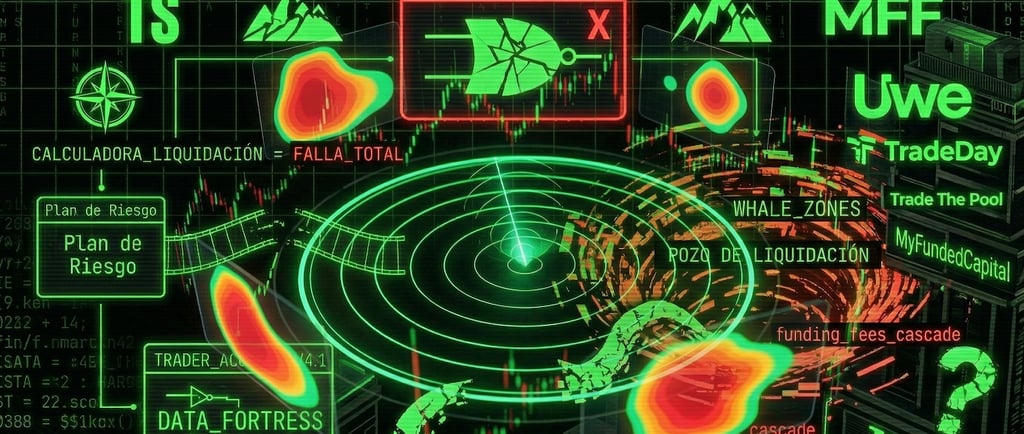
Article Image Description:
This image represents a futuristic "radar scanner" detecting energy and heat flows (liquidity) on a digital grid. It addresses the "Achilles' heel" of traders who rely solely on technical indicators: the difference between price and liquidity. This article includes high-trending terms such as Order Flow, Smart Money Concepts (SMC), and Liquidity Hunting.
Aston Capital Corp.
FL, United States
Contact
Newsletter
© 2026 Aston Capital Corp. All rights reserved.